
The Legacy of Racism in Baltimore: How Past Policy Informs Baltimore’s Present
by Kate Morton
Without knowing at least a bit of Baltimore history, one cannot truly know Baltimore City. Nicknamed “Charm City,” Baltimore has an incredibly complicated history with division and government intervention regarding race relations. Though Baltimore has been through countless policies contributing to racialized segregation, the 1937 Home Owners Loan Corporation (HOLC) redlining map and the detached 0.8 mile highway “to nowhere” urban renewal project abandoned in the 1970s, are two main top-down strategies by governmental forces that have consequences still seen today regarding health, economic disinvestment, and racial devalorization.
Prior to the Civil War, Baltimore was already a diverse Southern city. Between 1870 and 1900, many ex-Confederate southerners, European refugees, and African Americans moved into the city, doubling Baltimore’s population from 250,000 to 500,000 (Power 1983). As neighborhoods developed along racial and ethnic lines, frequent divisions between and within communities occurred. In the 1880s, around 250 upwardly mobile black families moved to Northwest Baltimore, away from ‘disreputable’ or less affluent black neighborhoods (Power, 1983). In white communities, two main approaches were taken to protect themselves from racial integration. White middle-class Baltimoreans began fleeing to the suburbs through patterns of white flight, while others used housing ordinances, homeowners’ associations, and blockbusting to discriminate against and segregate Black Baltimoreans. These individual actions by white Baltimoreans began to collectivize, marginalizing Black voters and prohibiting neighborhood integration (Power, 1983).
In 1910, a white homeowner sold their property to a Black buyer, breaking the city’s accepted color barrier. This break in tradition led to collective white backlash, prompting official and unofficial housing discrimination policies across Baltimore City (Power 1983). Thus, the first ever segregation ordinance in 1910 was created: Ordinance 610. This policy “was the first of three race-based housing ordinances in Baltimore,” and “many cities across the United States and even the world modeled” similar discrimination by law after Baltimore’s precedent (Armenti & Lothstein, 2021). The Supreme Court deemed the ordinances unconstitutional in 1917, but in the 7 years the ordinances existed, they led to racially dictated housing lines and policies that still impact the city today.
In the 1930s, the HOLC developed a perceived risk of lending standardizations across American cities. The grading system heavily factored ethnic composition of neighborhoods and deemed Black residential areas and racially shifting neighborhoods as inherently ‘risky’ for investment. Maps of these cities used a four-color grading system, with red-colored areas, marked as “hazardous,” hence the name “redlining” (Jackson 1985: 29). While this practice set a nationally formalized precedent, Jackson affirms that the HOLC did not “initiate” considerations of race and ethnicity in real-estate appraisal (Jackson 1985: 30). Rather, these redlining practices by the HOLC were built upon a long history of racial segregation, especially in Baltimore.
Baltimore’s 1937 HOLC map confined “hazardous” black neighborhoods to the outskirts in the east and west of Baltimore City, declaring housing along the central business strip to have the most appeal, only accessible to affluent white residents (HOLC 1937). These houses were declared the most “safe” for investment, appealing for economic purposes as they were the most accessible to business, transit, and commerce (HOLC 1937). As this “safe” housing was only available to white homeowners, nonwhite people were excluded from these economic and transit resources, only able to live in “hazardous” areas with poor housing maintenance and low homeownership (HOLC 1937). Looking at the 2020 census map, racial mapping patterns are still reflective of policies from the 1930s. The legacy of redlining continues to shape Baltimore’s racial and economic landscape, having catastrophic impacts on Black Baltimorean’s wellbeing and overall disinvestment. Morgan State University’s Lawrence Brown coined the visible racial divide as the “Black Butterfly” and “white L” (Theodos et al., 2019). (This has been clarified in red overtop the maps below.)
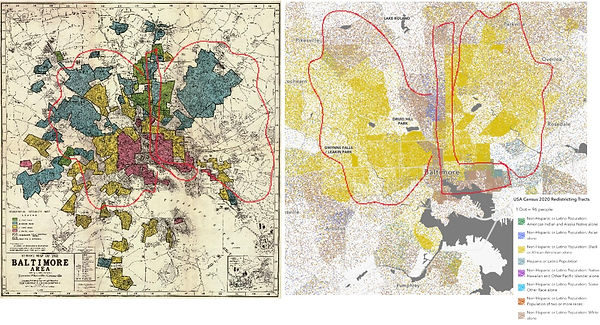
(Left: HOLC 1937; Right: US Census 2020)
Disinvestment perpetuated the historical impacts of federal housing policies on the racial and economic makeup of Baltimore. Neighborhoods in the ‘Black Butterfly’ were effectively cut off from access to mortgages, leading to housing and infrastructural dilapidation and uneven investment across Baltimore. Studies show that neighborhoods that are over 85% African American receive around four times less investment than neighborhoods of less than 50% African American (Theodos et al., 2019). Economic limitations and disinvestment from redlining affirm what Wilson asserts regarding surrounding ghettoization. Wilson suggests that racial segregation and discriminatory housing policies, like the HOLC map of 1937, led to the further entrenchment and isolation of disadvantaged groups, hindering their access to better education, employment opportunities, and social mobility (Wilson 1987). Wilson argues that these policies, when combined with trends in suburbanization, led to the continuation of “spatial concentration of poverty and disinvestment” (Wilson 1987:44).
This rings true in Baltimore, as white Baltimoreans benefit from racial mapping through well-funded institutions like the Baltimore Museum of Art, Johns Hopkins University, Loyola University, and the Walters Art Museum. This results in white valorization, as per-home sale prices from 2011-2016 were higher in the ‘white L’ by up to a $50,000 difference compared to sales in the ‘Black Butterfly’ (Theodos et al., 2019). Black Baltimoreans lacked social mobility and education opportunities due to government sanctioned ghettoization, further entrenching concentrations of poverty and social isolation in the ‘Black Butterfly.’ These further isolations and concentrations of economic decline result in significant health effects. In 2022, research found that redlined neighborhood residents in Baltimore have a shorter life expectancy by 5 years, compared to non-redlined residents (Huang, & Sehgal 2022). Research highlights that Baltimore redlining led to "worsened pollution" in addition to poor physical health (Eloshway 2022). By historically denying access to capital and resources in the ‘Black Butterfly,’ devalorization leading to degraded health in predominantly black neighborhoods is maintained due to the lasting impacts of redlining.
Additionally, urban renewal projects actively maintain historical racial divides. As Hirsch suggests, urban renewal projects often disrupt and destroy predominantly Black neighborhoods and lead to Black residential displacement. Regarding the creation of the second ghetto, or ghettoization resulting from governmental action, Hirsh asserts that “road and highway construction demonstrates the multifaceted character of state complicity in the second ghetto.” (Hirsch 2003). In Baltimore, the government successfully built a highway to tear through black communities and confine black residents to poor quality areas. With plans beginning in the 1930s, the construction of Baltimore’s ‘highway to nowhere,’ in the 1970s targeted a predominantly Black neighborhood in Baltimore, resulting in the condemnation and demolition of 971 homes and 62 businesses, displacing over 1,500 West Baltimore Residents (Eloshway 2022).
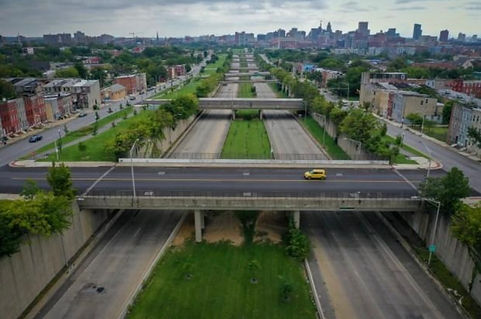
(Baltimore Sun, 2023: Image shows lasting impact of Baltimore’s ‘highway to nowhere’)
The project, still standing, serves as a lasting example of discrimination and governmentally planned destruction and disruption in the ‘Black Butterfly.’ The ‘highway to nowhere’ was condemned in 2021, efforts are underway to determine the abandoned highway’s future. While no plans have been officially set in place in 2024, Baltimoreans are pushing for community agency in the decision-making process. Some community members have proposed converting the abandoned space into a new ecological landscape like a park, or community garden (Eloshway 2022). These solutions could provide an urban landscape that serves the community, rather than continuing to divide it. With community-based solutions factored into these decisions, policy in Baltimore for the first time ever, could put an end to the perpetual division of the city.
--
Bibliography
Armenti, D., & Lothstein, A. (2021, April 28). Baltimore’s Pursuit of Fair Housing: A Brief History. Maryland Center for History and Culture. https://www.mdhistory.org/baltimores-pursuit-of-fair-housing-a-brief-history/
Eloshway, M. (2022). Highway to The Bottom: Recasting Baltimore’s Highway to Nowhere. https://dash.harvard.edu/handle/1/37371660
HOLC, Division of Research & Statistics. (1937). Residential Security Map of Baltimore Md. [Map]. https://jscholarship.library.jhu.edu/items/7583d1ed-61d7-4373-9ad2-e23ec862f3ee
Huang, S. J., & Sehgal, N. J. (2022). Association of historic redlining and present-day health in Baltimore. PLOS ONE, 17(1), e0261028. https://doi.org/10.1371/journal.pone.0261028
Power, G. (1983). Apartheid Baltimore Style: the Residential Segregation Ordinances of 1910-1913. Maryland Law Review, 42(2), 289. https://digitalcommons.law.umaryland.edu/mlr/vol42/iss2/4/
The Baltimore Sun. (2023). Highway to Nowhere. In The Baltimore Sun. https://www.baltimoresun.com/wp-content/uploads/migration/2023/02/21/WSD7MT6XM5FEDIETVWAJKD3HQ4.jpg?w=620
Theodos, B., Hangen, E., & Meixell, B. (2019). The Black Butterfly: Racial Segregation and Investment Patterns in Baltimore. The Urban Institute. https://apps.urban.org/features/baltimore-investment-flows/
US Census. (2020). Race and Ethnicity in the US by Dot Density (2020 Census). Www.arcgis.com. https://www.arcgis.com/apps/mapviewer/index.html?webmap=30d2e10d4d694b3eb4dc4d2e58dbb5a5